
mirror of https://github.com/grafana/loki
Tag:
Branch:
Tree:
8998539981
2005.12.08-limits
2025.08.04_metricsQuery
add-cleanup-branches-workflow
add-fallback-batcher
add-time-snap-middleware
aggregator-columnar
alt-err-prop
arrow-batch-agg-sorting
arve/add-claude.md
arve/remove_global_name_validation
ashwanth/restructure-query-section
auto-triager
aws-bug
backport-13116-to-release-3.3.x
backport-14221-to-release-3.2.x
backport-14780-to-release-3.2.x
backport-16045-to-k239
backport-17054-to-k249
backport-17129-to-k277
backport-21254-to-k297
backport-21990-to-release-3.6.x
backport-21990-to-release-3.7.x
backport-21995-to-release-3.6.x
backport-21995-to-release-3.7.x
backport-22000-to-release-3.7.x
benchmark-improvements
benclive/add-unique-parsed-keys-to-pointers
benclive/batch-aggregator-add
benclive/buffer-nodesource-channel
benclive/caching-logs
benclive/cleanup-partial-downloads
benclive/columnar-reader-impl
benclive/custom-stream-tools
benclive/dataobj-consumer-autoresearch
benclive/fix-engine-admission-lane-leak
benclive/fix-range-agg-without-by
benclive/hedge-requests-exp
benclive/implement-tsdb-writer-for-dataobj-consumers
benclive/index-compaction-poc
benclive/index-compaction-poc-2
benclive/index-testing-wip
benclive/k289-backport
benclive/k305-predicate-error
benclive/refactor-aggregator-tests
benclive/respect-encoding-flags-compat
benclive/scan-kafka
benclive/update-github-runners-to-use-free-or-self-hosted
benton/loki-mixin-updates
bound-parallelism-slicefor
callum-pipeline-sanitize-sm-values
callum-stream_limit-insights
callum-track-max-labels
cancel-delete-request-with-details-handler
chaudum/cleanup-ingester
chaudum/fix-blocked-query-edgecase
chaudum/generic-dataobj-section
chaudum/go-yaml
chaudum/inmemory-kafka
chaudum/k259
chaudum/metastore-toc-bucket
chaudum/module-cleanup
chaudum/move-state-workflow
chaudum/remove-deprecated-api-endpoints
chaudum/remove-deprecated-storage-backends
chaudum/remove-write-read-backend-targets
chaudum/renovate-rules-for-dependencies
chaudum/update-renovate-json
check-inverse-postings
columnar-agg
compare-igw-metastore
compare-igw-metastore2
config-parsing-hooks-refactor
dahoppe/claude/shuffle-shard-optimisation
dahoppe/heap-usage-metrics
dahoppe/load-shed-while-decompressing
dahoppe/pattern-tee-bytes-metric
dahoppe/shuffle-sharding-experimentation
danhopper/automemlimit
danhopper/colliding-metric-names
danhopper/fewer-goroutines-distributor
danhopper/no-more-shuffle-sharding
dataobj-compactor/consolidation-slo-metrics
dataobj-compactor/coordinator-loop
dataobj-compactor/index-merge-executor
dataobj-compactor/marker-management
dataobj-inspect-upgrade-otel
dataobj-store-sort-order
dedupe-metric-queries
dedupe-ranges
dependabot/go_modules/golang.org/x/crypto-0.45.0
dependabot/go_modules/operator/api/loki/golang.org/x/net-0.38.0
dependabot/go_modules/operator/golang.org/x/crypto-0.45.0
deps-update/main-actions-checkout-4.x
deps-update/main-actions-download-artifact-4.x
deps-update/main-anchore-sbom-action-0.x
deps-update/main-cachix-install-nix-action-31.x
deps-update/main-create-github-app-token-grafana-shared-workflows-0.x
deps-update/main-docker-build-push-action-6.x
deps-update/main-docker-login-action-4.x
deps-update/main-docker-setup-buildx-action-3.x
deps-update/main-github.comalecthomaschromav2
deps-update/main-github.comalicebobminiredisv2
deps-update/main-github.comawsaws-sdk-go-v2services3
deps-update/main-github.combaidubcebce-sdk-go
deps-update/main-github.combugerjsonparser
deps-update/main-github.comgo-sql-drivermysql
deps-update/main-github.comklauspostcompress
deps-update/main-github.comleodidogo-syslogv4
deps-update/main-github.compresslygoosev3
deps-update/main-github.comredisgo-redisv9
deps-update/main-github.comshirougopsutilv4
deps-update/main-github.comtwmbfranz-go
deps-update/main-github.comtwmbfranz-gopkgkadm
deps-update/main-go-github.com-apache-thrift-vulnerability
deps-update/main-go-github.com-containerd-containerd-v2-vulnerability
deps-update/main-go-go.opentelemetry.io-otel-vulnerability
deps-update/main-go-golang.org-x-crypto-vulnerability
deps-update/main-go-golang.org-x-net-vulnerability
deps-update/main-go-golang.org-x-sys-vulnerability
deps-update/main-go.opentelemetry.iocollectorpdata
deps-update/main-golangci-golangci-lint-2.x
deps-update/main-google.golang.orgapi
deps-update/main-google.golang.orggrpc
deps-update/main-googleapis-release-please-action-4.x
deps-update/main-k8s.ioapimachinery
deps-update/main-lock-file-maintenance
deps-update/main-logstash-9.3.4
deps-update/main-major-github.comtwmbfranz-gopkgkmsg
deps-update/main-memcached-1.x
deps-update/main-ruby-4.0.2
deps-update/main-ruby-4.x
deps-update/release-3.5.x-go-golang.org-x-crypto-vulnerability
deps-update/release-3.5.x-go-google.golang.org-grpc-vulnerability
deps-update/release-3.6.x-go
deps-update/release-3.6.x-go-github.com-containerd-containerd-v2-vulnerability
deps-update/release-3.6.x-go-github.com-grafana-loki-v3-vulnerability
deps-update/release-3.6.x-go-github.com-prometheus-prometheus-vulnerability
deps-update/release-3.6.x-go-go.opentelemetry.io-otel-vulnerability
deps-update/release-3.6.x-go-golang.org-x-crypto-vulnerability
deps-update/release-3.6.x-go-golang.org-x-net-vulnerability
deps-update/release-3.6.x-go-golang.org-x-sys-vulnerability
deps-update/release-3.6.x-golang-version-go-vulnerability
deps-update/release-3.7.x-go-github.com-apache-thrift-vulnerability
deps-update/release-3.7.x-go-github.com-containerd-containerd-v2-vulnerability
deps-update/release-3.7.x-go-go.opentelemetry.io-otel-sdk-vulnerability
deps-update/release-3.7.x-go-go.opentelemetry.io-otel-vulnerability
deps-update/release-3.7.x-go-golang.org-x-crypto-vulnerability
deps-update/release-3.7.x-go-golang.org-x-net-vulnerability
deps-update/release-3.7.x-go-golang.org-x-sys-vulnerability
deps-update/release-3.7.x-golang-version-go-vulnerability
docs-nvdh-log-queries
dont-log-every-indexset-call-
emit-events-without-debuggnig
enable-az-limits
fcjack/image-workflows
feat/dataobj-tsdb
find-correctness-bugs
fix-discarded-otlp-volume
fix/range-agg-step-alignment-v2
gerboland/loki-data-chunk-fetcher
grobinson/add-cluster-namespace-segmentation-key
grobinson/add-ctx-builder-flush
grobinson/add-estimated-rate-metric
grobinson/add-gauge-buffered-events
grobinson/add-gauge-num-sections
grobinson/add-lag-collector
grobinson/add-metric-time-partition-estimate
grobinson/add-rate-service
grobinson/add-separate-rate-store-limits-service
grobinson/approx-shuffle-shard-within-tenant-shuffle
grobinson/avoid-map-regrow
grobinson/avoid-map-regrow-k289
grobinson/build-image-ops-17-03-2026
grobinson/dedicated-first-two-partitions-late-logs
grobinson/dont-increment-atomic-just-to-check-limit
grobinson/drop-traffic-when-buffer-full
grobinson/experiment-different-builders-for-old-logs
grobinson/experiment-shard-stream-hash-within-segment-subring
grobinson/fix-limits-kafka-backoff
grobinson/fix-misnamed-metric
grobinson/fix-race-condition-in-tracker
grobinson/fix-race-in-builder-tests
grobinson/include-labels-in-size-calc
grobinson/limited-reader-claude
grobinson/no-cancel-producer
grobinson/rateservice
grobinson/remove-kotel
grobinson/run-gc-after-flush
grobinson/run-gc-after-flush-2
grobinson/split-partitions-into-old-and-new-entries
grobinson/support-parallel-flush
grobinson/test-lag-collector-ingesters
grobinson/test-optimizations-shuffle-shard
grobinson/test-p95-rate
grobinson/track-buffered-bytes-pattern-tee
grobinson/track-consumption-lag-offsets
grobinson/use-consumer-index-builders
grobinson/use-default-size-maps-to-avoid-reallocs
grobinson/use-local-distributor-rate-store-segmentation-keys
grobinson/use-stream-size-in-update-rates
grobinson/use-xxhash-for-better-avalanche-effect
grobinson/wip
grobinson/wip-flush-in-background
grobinson/wip2
handle-errors-per-category
hay-kot/loki-replay-compaction-research
helm-chart-tagged-6.30.0
helm-chart-tagged-6.44.0
helm-chart-tagged-6.56.0
helm-chart-tagged-7.1.0
helm-chart-weekly-6.55.0
helm-chart-weekly-7.1.0
helm-chart-weekly-7.2.0
hundredwatt/dataobj-consumer-autoresearch
ignore-yaml-errors
index-builder-lag-report-only
index-gateway-dataobj-tsdb-dualresolve
ingest-pipelines
isolate-sort-metrics
ivkalita/metastore-distributed-plus-scheduler
ivkalita/toc-aligned-logsobj-builders
jnewbigin/build-images
jnewbigin/lbac
jnewbigin/partition-metrics
k100
k101
k102
k103
k104
k105
k106
k107
k108
k109
k110
k111
k112
k113
k114
k115
k116
k117
k118
k119
k12
k120
k121
k122
k123
k124
k125
k126
k127
k128
k129
k13
k130
k131
k132
k133
k135
k136
k137
k138
k139
k14
k140
k141
k142
k143
k144
k145
k146
k147
k148
k149
k15
k150
k151
k152
k153
k154
k155
k156
k157
k158
k159
k16
k160
k161
k162
k163
k164
k165
k166
k167
k168
k169
k17
k170
k171
k172
k173
k174
k175
k176
k177
k178
k179
k18
k180
k181
k182
k183
k184
k185
k186
k187
k188
k189
k19
k190
k191
k192
k193
k194
k195
k195-backup
k196
k197
k198
k199
k20
k200
k201
k202
k203
k204
k205
k206
k207
k208
k209
k21
k210
k211
k212
k213
k214
k215
k216
k217
k218
k219
k22
k220
k221
k222
k228
k229
k23
k230
k231
k232
k233
k234
k235
k236
k237
k238
k239
k24
k240
k241
k242
k243
k244
k245
k246
k246-with-per-tenant-ruler-wal-replay
k247
k248
k248-distributor-lvl-detection
k248-level-detection-debugging
k248-levels-as-index
k249
k25
k250
k251
k252
k253
k254
k255
k256
k257
k258
k259
k26
k260
k261
k262
k263
k264
k265
k266
k267
k268
k269
k27
k270
k271
k272
k273
k274
k275
k276
k277
k278
k279
k28
k280
k281
k282
k283
k284
k284-ewelch
k284-metastore-improv
k285
k286
k287
k288
k289
k29
k290
k291
k291-rangeagg-shard
k292
k293
k294
k295
k296
k297
k298
k299
k30
k300
k301
k302
k303
k304
k305
k306
k307
k308
k31
k32
k33
k34
k35
k36
k37
k38
k39
k40
k41
k42
k43
k44
k45
k46
k47
k48
k49
k50
k51
k52
k53
k54
k55
k56
k57
k58
k59
k60
k61
k62
k63
k64
k65
k66
k67
k68
k69
k70
k71
k72
k73
k74
k75
k76
k77
k78
k79
k80
k81
k82
k83
k84
k85
k86
k87
k88
k89
k90
k91
k92
k93
k94
k95
k96
k97
k98
k99
kk/test
label-filter-predicate-pushdown
leizor/policy-reject-old-samples
logql-analyzer-wasm
main
meher/a-separate-trace-for-engine-execution
meher/fix-goroutine-leak-tailer
meher/local-worker-setup
meher/log-partition-ring-cache-map-size
meher/parition-ring-manual-disable
meher/persistent-workerLoop-per-worker-connection
meher/query-lab
meher/remove-frontend-rule
meher/worker-phases-histogram
paul1r/k294_dupes
periklis/k280-max-query-bytes-read
periklis/max-query-bytes-read
push-rnvszrozvuoq
query-tee-mismatch-analysis-tool
query-timestamp-validation
rangeaggonly
rebase-idiomatic-worker-pattern
release-2.0.1
release-2.2
release-2.2.1
release-2.3
release-2.4
release-2.5.x
release-2.6.x
release-2.7.x
release-2.8.x
release-2.8.x-fix-failing-test
release-2.9.x
release-3.0.x
release-3.1.x
release-3.2.x
release-3.3.x
release-3.4.x
release-3.5.x
release-3.6.x
release-3.7.0-from-k
release-3.7.x
release-please--branches--k300
release-please--branches--k301
release-please--branches--k303
release-please--branches--k304
release-please--branches--k305
release-please--branches--k306
release-please--branches--k307
release-please--branches--k308
release-please--branches--main--components--operator
release-please--branches--release-2.9.x
release-please--branches--release-3.5.x
remote-rule-evaluator-middleware
remove-early-eof
reuse-labels-in-aggregator
salvacorts/k289/debub-lbac-volume
salvacorts/multi-merge
salvacorts/over-sophie-predicateclamp
salvacorts/reuse-forward-allo-headers
salvacorts/scan-cache-stats
salvacorts/sjwtaskclamp›-with-ashwanth-changes
salvacorts/task_ids
scantimerangepushup
scheduler-assignlock-granular
scheduler_contentions
shantanu/dataobj-compactor
shantanu/dedupe-with-sm
shantanu/fix-k290-deps
shantanu/fix-patterns-newlines
shantanu/tmp-fix-proj-pushdown
shantanu/tmp-proj-pushdown-bug
shantanu/update-go-deps
shantanu/use-yarn-release-workflows
sjwbillingtest
sjwpoolmemory
sjwtaskclamp
sjwtaskclamp2
skip-recent-queries-comparison
solid-moon-2
sophiewaldman-patch-1
sp/fix-discover-service-name
spiridonov-agg-perf-2
spiridonov-agg-sharding
spiridonov-agg-sharding-2
spiridonov-engine-sandbox
start-replay-support
stop-using-retry-flag
structured-metadata-push-down-3
svennergr-patch-1
task-batch-assign
test-labeler
test-query-limits-fixes
test-workflow
thor-ingestion
thor-working-version
tinitiuset/ft-loki-mixin
tpatterson/expose-partition-ring
trevorwhitney/structured-metadata-push-down
twhitney/goldfish-mcp
update-prometheus
update-version-to-1.26.3
wire-dispatch
wire-metrics
wrap-downloading-file-errors
xcap-coverage
xcap-pipeline-inject
2.8.3
helm-loki-3.0.0
helm-loki-3.0.1
helm-loki-3.0.2
helm-loki-3.0.3
helm-loki-3.0.4
helm-loki-3.0.5
helm-loki-3.0.6
helm-loki-3.0.7
helm-loki-3.0.8
helm-loki-3.0.9
helm-loki-3.1.0
helm-loki-3.10.0
helm-loki-3.2.0
helm-loki-3.2.1
helm-loki-3.2.2
helm-loki-3.3.0
helm-loki-3.3.1
helm-loki-3.3.2
helm-loki-3.3.3
helm-loki-3.3.4
helm-loki-3.4.0
helm-loki-3.4.1
helm-loki-3.4.2
helm-loki-3.4.3
helm-loki-3.5.0
helm-loki-3.6.0
helm-loki-3.6.1
helm-loki-3.7.0
helm-loki-3.8.0
helm-loki-3.8.1
helm-loki-3.8.2
helm-loki-3.9.0
helm-loki-4.0.0
helm-loki-4.1.0
helm-loki-4.10.0
helm-loki-4.2.0
helm-loki-4.3.0
helm-loki-4.4.0
helm-loki-4.4.1
helm-loki-4.4.2
helm-loki-4.5.0
helm-loki-4.5.1
helm-loki-4.6.0
helm-loki-4.6.1
helm-loki-4.6.2
helm-loki-4.7.0
helm-loki-4.8.0
helm-loki-4.9.0
helm-loki-5.0.0
helm-loki-5.1.0
helm-loki-5.10.0
helm-loki-5.11.0
helm-loki-5.12.0
helm-loki-5.13.0
helm-loki-5.14.0
helm-loki-5.14.1
helm-loki-5.15.0
helm-loki-5.17.0
helm-loki-5.18.0
helm-loki-5.18.1
helm-loki-5.19.0
helm-loki-5.2.0
helm-loki-5.20.0
helm-loki-5.21.0
helm-loki-5.22.0
helm-loki-5.22.1
helm-loki-5.22.2
helm-loki-5.23.0
helm-loki-5.23.1
helm-loki-5.24.0
helm-loki-5.25.0
helm-loki-5.26.0
helm-loki-5.27.0
helm-loki-5.28.0
helm-loki-5.29.0
helm-loki-5.3.0
helm-loki-5.3.1
helm-loki-5.30.0
helm-loki-5.31.0
helm-loki-5.32.0
helm-loki-5.33.0
helm-loki-5.34.0
helm-loki-5.35.0
helm-loki-5.36.0
helm-loki-5.36.1
helm-loki-5.36.2
helm-loki-5.36.3
helm-loki-5.37.0
helm-loki-5.38.0
helm-loki-5.39.0
helm-loki-5.4.0
helm-loki-5.40.1
helm-loki-5.41.0
helm-loki-5.41.1
helm-loki-5.41.2
helm-loki-5.41.3
helm-loki-5.41.4
helm-loki-5.41.5
helm-loki-5.41.6
helm-loki-5.41.7
helm-loki-5.41.8
helm-loki-5.41.9-distributed
helm-loki-5.41.9-distributed-rc2
helm-loki-5.42.0
helm-loki-5.42.1
helm-loki-5.42.2
helm-loki-5.42.3
helm-loki-5.43.0
helm-loki-5.43.1
helm-loki-5.43.2
helm-loki-5.43.3
helm-loki-5.43.4
helm-loki-5.43.5
helm-loki-5.43.6
helm-loki-5.43.7
helm-loki-5.44.0
helm-loki-5.44.1
helm-loki-5.44.2
helm-loki-5.44.3
helm-loki-5.44.4
helm-loki-5.45.0
helm-loki-5.46.0
helm-loki-5.47.0
helm-loki-5.47.1
helm-loki-5.47.2
helm-loki-5.48.0
helm-loki-5.5.0
helm-loki-5.5.1
helm-loki-5.5.10
helm-loki-5.5.11
helm-loki-5.5.12
helm-loki-5.5.2
helm-loki-5.5.3
helm-loki-5.5.4
helm-loki-5.5.5
helm-loki-5.5.6
helm-loki-5.5.7
helm-loki-5.5.8
helm-loki-5.5.9
helm-loki-5.6.0
helm-loki-5.6.1
helm-loki-5.6.2
helm-loki-5.6.3
helm-loki-5.6.4
helm-loki-5.7.1
helm-loki-5.8.0
helm-loki-5.8.1
helm-loki-5.8.10
helm-loki-5.8.11
helm-loki-5.8.2
helm-loki-5.8.3
helm-loki-5.8.4
helm-loki-5.8.5
helm-loki-5.8.6
helm-loki-5.8.7
helm-loki-5.8.8
helm-loki-5.8.9
helm-loki-5.9.0
helm-loki-5.9.1
helm-loki-5.9.2
helm-loki-6.0.0
helm-loki-6.1.0
helm-loki-6.10.0
helm-loki-6.10.1
helm-loki-6.10.2
helm-loki-6.11.0
helm-loki-6.12.0
helm-loki-6.15.0
helm-loki-6.16.0
helm-loki-6.18.0
helm-loki-6.19.0
helm-loki-6.19.0-weekly.227
helm-loki-6.2.0
helm-loki-6.2.1
helm-loki-6.2.2
helm-loki-6.2.3
helm-loki-6.2.4
helm-loki-6.2.5
helm-loki-6.20.0
helm-loki-6.20.0-weekly.229
helm-loki-6.21.0
helm-loki-6.22.0
helm-loki-6.22.0-weekly.230
helm-loki-6.23.0
helm-loki-6.23.0-weekly.231
helm-loki-6.24.0
helm-loki-6.24.0-weekly.232
helm-loki-6.24.1
helm-loki-6.25.0
helm-loki-6.25.1
helm-loki-6.26.0
helm-loki-6.27.0
helm-loki-6.28.0
helm-loki-6.29.0
helm-loki-6.3.0
helm-loki-6.3.1
helm-loki-6.3.2
helm-loki-6.3.3
helm-loki-6.3.4
helm-loki-6.30.0
helm-loki-6.30.1
helm-loki-6.31.0
helm-loki-6.32.0
helm-loki-6.33.0
helm-loki-6.34.0
helm-loki-6.35.0
helm-loki-6.35.1
helm-loki-6.36.0
helm-loki-6.36.1
helm-loki-6.37.0
helm-loki-6.38.0
helm-loki-6.39.0
helm-loki-6.4.0
helm-loki-6.4.1
helm-loki-6.4.2
helm-loki-6.40.0
helm-loki-6.41.0
helm-loki-6.41.1
helm-loki-6.42.0
helm-loki-6.43.0
helm-loki-6.44.0
helm-loki-6.45.0
helm-loki-6.45.1
helm-loki-6.45.2
helm-loki-6.46.0
helm-loki-6.48.0
helm-loki-6.49.0
helm-loki-6.5.0
helm-loki-6.5.1
helm-loki-6.5.2
helm-loki-6.50.0
helm-loki-6.51.0
helm-loki-6.52.0
helm-loki-6.53.0
helm-loki-6.54.0
helm-loki-6.55.0
helm-loki-6.6.0
helm-loki-6.6.1
helm-loki-6.6.2
helm-loki-6.6.3
helm-loki-6.6.4
helm-loki-6.6.5
helm-loki-6.6.6
helm-loki-6.7.0
helm-loki-6.7.1
helm-loki-6.7.2
helm-loki-6.7.3
helm-loki-6.7.4
helm-loki-6.8.0
helm-loki-6.9.0
helm-loki-7.0.0
operator/v0.0.1-test
operator/v0.0.2-test
operator/v0.10.0
operator/v0.10.1
operator/v0.4.0
operator/v0.5.0
operator/v0.6.0
operator/v0.6.1
operator/v0.6.2
operator/v0.7.0
operator/v0.7.1
operator/v0.8.0
operator/v0.9.0
pkg/logql/syntax/v0.0.1
v0.1.0
v0.2.0
v0.3.0
v0.4.0
v1.0.0
v1.0.1
v1.0.2
v1.1.0
v1.2.0
v1.3.0
v1.4.0
v1.4.1
v1.5.0
v1.6.0
v1.6.1
v2.0.0
v2.0.1
v2.1.0
v2.2.0
v2.2.1
v2.3.0
v2.4.0
v2.4.1
v2.4.2
v2.5.0
v2.6.0
v2.6.1
v2.7.0
v2.7.1
v2.7.2
v2.7.3
v2.7.4
v2.7.5
v2.7.6
v2.7.7
v2.8.0
v2.8.1
v2.8.10
v2.8.11
v2.8.2
v2.8.3
v2.8.4
v2.8.5
v2.8.6
v2.8.7
v2.8.8
v2.8.9
v2.9.0
v2.9.1
v2.9.10
v2.9.11
v2.9.12
v2.9.13
v2.9.14
v2.9.15
v2.9.16
v2.9.17
v2.9.2
v2.9.3
v2.9.4
v2.9.5
v2.9.6
v2.9.7
v2.9.8
v2.9.9
v3.0.0
v3.0.1
v3.1.0
v3.1.1
v3.1.2
v3.2.0
v3.2.1
v3.2.2
v3.3.0
v3.3.1
v3.3.2
v3.3.3
v3.3.4
v3.4.0
v3.4.1
v3.4.2
v3.4.3
v3.4.4
v3.4.5
v3.4.6
v3.5.0
v3.5.1
v3.5.10
v3.5.11
v3.5.12
v3.5.2
v3.5.3
v3.5.4
v3.5.5
v3.5.6
v3.5.7
v3.5.8
v3.5.9
v3.6.0
v3.6.1
v3.6.10
v3.6.11
v3.6.2
v3.6.3
v3.6.4
v3.6.5
v3.6.6
v3.6.7
v3.6.8
v3.6.9
v3.7.0
v3.7.1
v3.7.2
${ noResults }
232 Commits (89985399817dde28fe5b94de990133d904bc3e5b)
| Author | SHA1 | Message | Date |
|---|---|---|---|
 Karsten Jeschkies
|
fbcaa1d5d8
|
Lazily decode series protobuf. (#10071)
**What this PR does / why we need it**:
The protobuf decoding for series responses runs into a memory issue for
many series. The response is only merged and passed through the front
end. It is more efficient to decode the protobuf encoded series lazily.
And `decode`, `merge`, `encode` benchmark shows the benefit of
transcoding the protobuf series message into a JSON response directly.
This change will not impact production code since it only applies to
protobuf encoding messaging between the querier and query frontend that
must be explicitly enabled.
```
› go test -v -run=^$ -bench "Benchmark_DecodeMergeEncodeCycle" -memprofile memory_base.prof -count=10 ./pkg/querier/queryrange > before.txt
› go test -v -run=^$ -bench "Benchmark_DecodeMergeEncodeCycle" -memprofile memory_base.prof -count=10 ./pkg/querier/queryrange > before.txt
› benchstat before.txt after.txt
before.txt:5: missing iteration count
after.txt:5: missing iteration count
goos: linux
goarch: amd64
pkg: github.com/grafana/loki/pkg/querier/queryrange
cpu: AMD Ryzen 7 3700X 8-Core Processor
│ before.txt │ after.txt │
│ sec/op │ sec/op vs base │
_DecodeMergeEncodeCycle-16 2537.7m ± 2% 934.2m ± 1% -63.19% (p=0.000 n=10)
│ before.txt │ after.txt │
│ B/op │ B/op vs base │
_DecodeMergeEncodeCycle-16 1723.4Mi ± 0% 641.1Mi ± 0% -62.80% (p=0.000 n=10)
│ before.txt │ after.txt │
│ allocs/op │ allocs/op vs base │
_DecodeMergeEncodeCycle-16 20240.6k ± 0% 203.0k ± 0% -99.00% (p=0.000 n=10)
```
**Checklist**
- [ ] Reviewed the
[`CONTRIBUTING.md`](https://github.com/grafana/loki/blob/main/CONTRIBUTING.md)
guide (**required**)
- [ ] Documentation added
- [x] Tests updated
- [ ] `CHANGELOG.md` updated
- [ ] If the change is worth mentioning in the release notes, add
`add-to-release-notes` label
- [ ] Changes that require user attention or interaction to upgrade are
documented in `docs/sources/setup/upgrade/_index.md`
- [ ] For Helm chart changes bump the Helm chart version in
`production/helm/loki/Chart.yaml` and update
`production/helm/loki/CHANGELOG.md` and
`production/helm/loki/README.md`. [Example
PR](
|
3 years ago |
|
Travis Patterson
|
77b04b7963
|
Logging improvements for volume requests (#10099)
I noticed we were logging volume requests as metric requests in `metrics.go`. This PR logs volume requests on their own with relevant data. |
3 years ago |
|
Travis Patterson
|
bfd196aa66
|
sort sort log volumes by size (#10045)
To save some frontend work, this PR sorts all the log volumes by volume rather than name. For range queries, only the first value is used. |
3 years ago |
|
Trevor Whitney
|
a12311c5c8
|
Allow volume to be aggregated by label (#9988)
Add a `aggregateBy` query parameter to the `series_volume` endpoint, and rename that endpoint to just `volume`. This allows users to get volumes aggregated into top level labels, rather label+value pairs. --------- Co-authored-by: Travis Patterson <travis.patterson@grafana.com> |
3 years ago |
|
Salva Corts
|
3f161f5c1a
|
Improve observability for non-indexed labels usage (#9993)
**What this PR does / why we need it**:
In https://github.com/grafana/loki/pull/9700, we support encoding and
decoding metadata for each entry into the chunks.
In this PR we:
- Update the bytes processed stats to account for the bytes from those
non-indexed labels
- Add new stats for bytes processed for those non-indexed labels
- Add new ingestion metrics to track ingested non-indexed bytes
**Checklist**
- [ ] Reviewed the
[`CONTRIBUTING.md`](https://github.com/grafana/loki/blob/main/CONTRIBUTING.md)
guide (**required**)
- [ ] Documentation added
- [x] Tests updated
- [ ] `CHANGELOG.md` updated
- [ ] If the change is worth mentioning in the release notes, add
`add-to-release-notes` label
- [ ] Changes that require user attention or interaction to upgrade are
documented in `docs/sources/upgrading/_index.md`
- [ ] For Helm chart changes bump the Helm chart version in
`production/helm/loki/Chart.yaml` and update
`production/helm/loki/CHANGELOG.md` and
`production/helm/loki/README.md`. [Example
PR](
|
3 years ago |
|
Karsten Jeschkies
|
efac690328
|
Use series hash to identify uniques in merge. (#9985)
**What this PR does / why we need it**:
A run of the protobuf encoding for the querier showed a spike in memory
usage in the `codec.MergeResponse` method. The routine was allocating a
lot of memory for the `series.String()` method which is then hashed.
Instead, we can use a `uint64` hash.
```
› go test -v -run=^$ -bench "Benchmark_MergeResponses$" -count=10 ./pkg/querier/queryrange
...
│ before.txt │ after.txt │
│ sec/op │ sec/op vs base │
_MergeResponses-16 4.563 ± 1% 1.197 ± 1% -73.77% (p=0.000 n=10)
│ before.txt │ after.txt │
│ B/op │ B/op vs base │
_MergeResponses-16 6578.715Mi ± 0% 2.362Mi ± 0% -99.96% (p=0.000 n=10)
│ before.txt │ after.txt │
│ allocs/op │ allocs/op vs base │
_MergeResponses-16 40500.1k ± 0% 100.1k ± 0% -99.75% (p=0.000 n=10)
```
**Checklist**
- [ ] Reviewed the
[`CONTRIBUTING.md`](https://github.com/grafana/loki/blob/main/CONTRIBUTING.md)
guide (**required**)
- [ ] Documentation added
- [x] Tests updated
- [ ] `CHANGELOG.md` updated
- [ ] If the change is worth mentioning in the release notes, add
`add-to-release-notes` label
- [ ] Changes that require user attention or interaction to upgrade are
documented in `docs/sources/upgrading/_index.md`
- [ ] For Helm chart changes bump the Helm chart version in
`production/helm/loki/Chart.yaml` and update
`production/helm/loki/CHANGELOG.md` and
`production/helm/loki/README.md`. [Example
PR](
|
3 years ago |
|
Ed Welch
|
fa6f9c638a
|
Loki: add 'post_filter_lines' stat for tracking how many lines are match a queries filter expression(s) (#9983)
**What this PR does / why we need it**:
To better understand query behavior and labeling strategies of users,
logging the number of log lines "post filtering" can be very useful, we
already log the total_lines processed in a query so this will allow us
to see how many lines in the label selector matched what the query was
looking for.
**Which issue(s) this PR fixes**:
Fixes #<issue number>
**Special notes for your reviewer**:
**Checklist**
- [ ] Reviewed the
[`CONTRIBUTING.md`](https://github.com/grafana/loki/blob/main/CONTRIBUTING.md)
guide (**required**)
- [ ] Documentation added
- [ ] Tests updated
- [ ] `CHANGELOG.md` updated
- [ ] If the change is worth mentioning in the release notes, add
`add-to-release-notes` label
- [ ] Changes that require user attention or interaction to upgrade are
documented in `docs/sources/upgrading/_index.md`
- [ ] For Helm chart changes bump the Helm chart version in
`production/helm/loki/Chart.yaml` and update
`production/helm/loki/CHANGELOG.md` and
`production/helm/loki/README.md`. [Example
PR](
|
3 years ago |
|
Karsten Jeschkies
|
a09cb07e98
|
Define protobufs for topk and cms. (#9933)
**What this PR does / why we need it**:
This change introduces Protobuf models for the sketch data structures
which will be used to shard topk queries.
**Checklist**
- [ ] Reviewed the
[`CONTRIBUTING.md`](https://github.com/grafana/loki/blob/main/CONTRIBUTING.md)
guide (**required**)
- [ ] Documentation added
- [x] Tests updated
- [ ] `CHANGELOG.md` updated
- [ ] If the change is worth mentioning in the release notes, add
`add-to-release-notes` label
- [ ] Changes that require user attention or interaction to upgrade are
documented in `docs/sources/upgrading/_index.md`
- [ ] For Helm chart changes bump the Helm chart version in
`production/helm/loki/Chart.yaml` and update
`production/helm/loki/CHANGELOG.md` and
`production/helm/loki/README.md`. [Example
PR](
|
3 years ago |
|
Karsten Jeschkies
|
c2c5249676
|
Remove goroutines from limiter middleware. (#9923)
**What this PR does / why we need it**: The `limitedRoundTripper` would spawn thousands if not millions of goroutines. However, they were mostly idle waiting for downstream calls. This would congest the Go scheduler. A semaphore is more suitable to control concurrency as the [example](https://pkg.go.dev/golang.org/x/sync/semaphore#example-package-WorkerPool) in the documentation illustrates. |
3 years ago |
|
Salva Corts
|
aae13c376d
|
Add metadata to push payload (#9694)
**What this PR does / why we need it**: We are adding support for attaching labels to each log line. This is one of the series of the PRs broken up to make it easier to review changes. This PR updates the push payload to send labels with each log entry optionally. The log labels are supposed to be in the same format as the stream labels. Just to put it out, here is how it would look for proto and json push payload with same data: **proto(`endpoint`: `(/loki/api/v1/push|/api/prom/push)`, `Content-Type`: `application/x-protobuf`)**(payload built using [push.Stream]( |
3 years ago |
|
Trevor Whitney
|
9e19ff006c
|
Add targetLabels to SeriesVolume requests (#9878)
Adds optional `targetLabels` parameter to `series_volume` and `series_volume_range` requests that controls how volumes are aggregated. When provided, volumes are aggregated into the intersections of the provided `targetLabels` only. |
3 years ago |
|
Travis Patterson
|
e2e695e8cd
|
Get basic statistics from series volume requests (#9832)
The `series_volume` endpoint returns stats about the call. This PR wires things up such that basic stats are returned: - Execution time - Number of responses |
3 years ago |
|
Karsten Jeschkies
|
f5992274f4
|
Switch on pointer `*logproto.SeriesResponse` in JSON serialization. (#9868)
**What this PR does / why we need it**: Commit |
3 years ago |
|
Karsten Jeschkies
|
b35bbd80d6
|
Support content negotiation between query frontend and querier. (#9813)
**What this PR does / why we need it**:
Currently, the querier sends results to the query frontend in JSON which
is then decoded to Protobuf. It is more efficient to send the results as
Protobuf.
This will also allow to extend the results with custom data structures.
The change is backwards compatible through content negotiation.
**Special notes for your reviewer**:
**Checklist**
- [x] Reviewed the
[`CONTRIBUTING.md`](https://github.com/grafana/loki/blob/main/CONTRIBUTING.md)
guide (**required**)
- [x] Documentation added
- [x] Tests updated
- [x] `CHANGELOG.md` updated
- [ ] If the change is worth mentioning in the release notes, add
`add-to-release-notes` label
- [ ] Changes that require user attention or interaction to upgrade are
documented in `docs/sources/upgrading/_index.md`
- [ ] For Helm chart changes bump the Helm chart version in
`production/helm/loki/Chart.yaml` and update
`production/helm/loki/CHANGELOG.md` and
`production/helm/loki/README.md`. [Example
PR](
|
3 years ago |
|
Owen Diehl
|
b251a10234
|
uses lowercase standard for logging and adds total bytes to shard res… (#9828)
Minor logging cleanup + helpful to have total bytes on this log line to correlate without needing to derive total bytes from factor * bytes_per_shard |
3 years ago |
|
Trevor Whitney
|
d4cfbaac4f
|
Implement series volume range queries (#9812)
This PR adds a `series_volume_range` endpoint which allows for series volume queries over time with a specified step, returning timeseries data in the form of a Prometheus matrix response. The existing `series_volume` endpoint still returns Prometheus vector responses, and hardcodes the step to 0. |
3 years ago |
|
Salva Corts
|
6cc581bd26
|
Add back cache stats for index stats requests (#9816)
**What this PR does / why we need it**:
In https://github.com/grafana/loki/pull/9536, we added cache stats for
index stats requests. That PR had a bug that inflated the query stats
due to reusing the stats context in the query engine. Therefore, we had
to revert the PR at https://github.com/grafana/loki/pull/9721.
This PR brings back the changes from
https://github.com/grafana/loki/pull/9536 but fixes the inflated starts
by no longer reusing the same context in the query engine, but rather
creating a new one for the shard resolver.
I tested it on a dev cluster and seems to be working fine. here's the
output for the same query:
**Stats with the bug from #9536**:
```
...
Cache.StatsResult.Requests 980
Cache.StatsResult.EntriesRequested 490
Cache.StatsResult.EntriesFound 0
Cache.StatsResult.EntriesStored 490
Cache.StatsResult.BytesSent 0 B
Cache.StatsResult.BytesReceived 0 B
...
Summary.BytesProcessedPerSecond 43 GB
Summary.LinesProcessedPerSecond 93305142
Summary.TotalBytesProcessed 945 GB
Summary.TotalLinesProcessed 2059694183
```
**Stats from _main_**
```
...
Summary.BytesProcessedPerSecond 1.6 GB
Summary.LinesProcessedPerSecond 3403718
Summary.TotalBytesProcessed 95 GB
Summary.TotalLinesProcessed 207971404
```
**Stats with fix in this PR**
```
..
Cache.StatsResult.Requests 132
Cache.StatsResult.EntriesRequested 66
Cache.StatsResult.EntriesFound 0
Cache.StatsResult.EntriesStored 66
Cache.StatsResult.BytesSent 0 B
Cache.StatsResult.BytesReceived 0 B
...
Summary.BytesProcessedPerSecond 4.3 GB
Summary.LinesProcessedPerSecond 9468900
Summary.TotalBytesProcessed 95 GB
Summary.TotalLinesProcessed 207793816
```
As can be seen, with the changes in this PR, the summary stats are no
longer inflated.
**Which issue(s) this PR fixes**:
Fixes https://github.com/grafana/loki/pull/9536
**Special notes for your reviewer**:
I think it's ok to skip reviewing the changes from the commit
cherry-picking the changes from
https://github.com/grafana/loki/pull/9536
**Checklist**
- [ ] Reviewed the
[`CONTRIBUTING.md`](https://github.com/grafana/loki/blob/main/CONTRIBUTING.md)
guide (**required**)
- [ ] Documentation added
- [ ] Tests updated
- [ ] `CHANGELOG.md` updated
- [ ] If the change is worth mentioning in the release notes, add
`add-to-release-notes` label
- [ ] Changes that require user attention or interaction to upgrade are
documented in `docs/sources/upgrading/_index.md`
- [ ] For Helm chart changes bump the Helm chart version in
`production/helm/loki/Chart.yaml` and update
`production/helm/loki/CHANGELOG.md` and
`production/helm/loki/README.md`. [Example
PR](
|
3 years ago |
|
Owen Diehl
|
e2a63e582c
|
adds tsdb-max-bytes-per-shard limit (#9811)
Adds the per tenant limit `tsdb-max-bytes-per-shard` which is used in configuring the shard size for tsdb subqueries. This effectively gives control over how big subqueries should be (assuming they're shardable). The default is no different (`600MB`) than the previously hardcoded initial value. This should help us iterate to find optimal shard sizes to improve operations in the long term. |
3 years ago |
|
Travis Patterson
|
8ca035ffbf
|
Log Volume: Do the prometheus-format conversion in dedicated middleware (#9776)
This PR moves the Prometheus-format conversion to it's own middleware. This keeps it all in one place and consolidates logic that was in many places. It also sets us up to make range queries as a next step. |
3 years ago |
|
Sandeep Sukhani
|
3e1f2fc273
|
caching: do not try to fill the gap in log results cache when the new query interval does not overlap the cached query interval (#9757)
**What this PR does / why we need it**:
Currently, when we find a relevant cached negative response for a logs
query, we do the following:
* If the cached query completely covers the new query:
* return back an empty response.
* else:
* fill the gaps on either/both sides of the cached query.
The problem with filling the gaps is that when the cached query does not
overlap at all with the new query, we have to extend the query beyond
what the query requests for. However, with the logs query, we have a
limit on the number of lines we can send back in the response. So, this
could result in the query response having logs which were not requested
by the query, which then get filtered out by the [response
extractor](
|
3 years ago |
|
Susana Ferreira
|
35465d0297
|
Fix instant query summary split stats (#9773)
**What this PR does / why we need it**:
Fix instant query summary statistic's `splits` corresponding to the
number of subqueries a query is split into based on
`split_queries_by_interval`.
* Update rangemapper with a statistics structure to include the number
of split queries a query is mapped into.
* In the `split_by_range` middleware once the mapped query is returned
update the middleware statistics with the number of split queries. This
value will then be merged with the statistics of the Loki response.
**Checklist**
- [ ] Reviewed the
[`CONTRIBUTING.md`](https://github.com/grafana/loki/blob/main/CONTRIBUTING.md)
guide (**required**)
- [ ] Documentation added
- [x] Tests updated
- [x] `CHANGELOG.md` updated
- [ ] If the change is worth mentioning in the release notes, add
`add-to-release-notes` label
- [ ] Changes that require user attention or interaction to upgrade are
documented in `docs/sources/upgrading/_index.md`
- [ ] For Helm chart changes bump the Helm chart version in
`production/helm/loki/Chart.yaml` and update
`production/helm/loki/CHANGELOG.md` and
`production/helm/loki/README.md`. [Example
PR](
|
3 years ago |
|
Travis Patterson
|
4da0f63789
|
Remove unused Value field (#9774)
We didn't end up needing the `Value` field because we can express everything we need to as selectors |
3 years ago |
|
Travis Patterson
|
806674fdaa
|
Add log-volume feature flag (#9762)
Adds a feature flag for use with the new log-volume endpoints so associated features can be rolled out incrementally. |
3 years ago |
|
Trevor Whitney
|
dbc3040739
|
Convert SeriesVolume response to prometheus-style (#9703)
Changes the response type of the label volume stats endpoint to return volumes as prometheus-style timeseries metrics. It currently only supports instant queries, but is a necessary step to eventually supporting range queries. |
3 years ago |
|
Salva Corts
|
b7359c5d53
|
Revert "Add summary stats and metrics for stats cache (#9536)" (#9721)
This reverts commit
|
3 years ago |
|
Travis Patterson
|
db97058a84
|
Series volume endpoint (#9704)
This changes the `label_volume` endpoint to the `series_volume`
endpoint. The new endpoint still returns volumes but now it does it for
the requested streams defined by the selector names passed rather than
individual labels. All relevant non-requested labels are aggregated into
the returned results

ex: Assume we have the following streams:
```
{cluster="prod", team="A", component="foo"}
{cluster="prod", team="B", component="foo"}
{cluster="dev", team="A", component="foo"}
{cluster="dev", team="B", component="foo"}
```

- requesting `{cluster="prod"}` returns one result for all streams
containing `{cluster="prod"}`
- requesting `{cluster=~".+"}` returns two results for the streams
containing `{cluster="prod"}` and `{cluster="dev"}`
- requesting `{cluster=~".+", team=".+"}` returns four results for the
streams containing:
```
{cluster="prod", team="A"}
{cluster="prod", team="B"}
{cluster="dev", team="A"}
{cluster="dev", team="B"}
```

---------

Co-authored-by: Trevor Whitney <trevorjwhitney@gmail.com>
|
3 years ago |
|
Trevor Whitney
|
4a56445686
|
Upgrade `golangci-lint` and fix linting errors (#9601)
**What this PR does / why we need it**: Upgrade `golangci-lint` and fixes all the errors. The upgrade includes some stricter linting. |
3 years ago |
|
Travis Patterson
|
065bee7e72
|
Label Volume Endpoint (#9588)
For a given set of matchers, returns the top N associated label/value
pairs by volume. A query for `{cluster=prod}` will return

```
cluster=prod: size (total logs matching this matcher)
 .
 .
 .
nth-label=nth-value
```

This is to service use cases where users want to understand where their
log volume has come from by label without making multiple requests to
the stats endpoint.

Note: This PR is a monster but it's mostly plumbing. I've pointed out
the most interesting bits that actually get the volumes from
ingesters/indexs
|
3 years ago |
|
Salva Corts
|
73ac208981
|
Improve docs for empty value in cache compression config (#9649)
**What this PR does / why we need it**:
Follow up PR for
https://github.com/grafana/loki/pull/9535#discussion_r1218167670
**Checklist**
- [x] Reviewed the
[`CONTRIBUTING.md`](https://github.com/grafana/loki/blob/main/CONTRIBUTING.md)
guide (**required**)
- [x] Documentation added
- [ ] Tests updated
- [ ] `CHANGELOG.md` updated
- [ ] Changes that require user attention or interaction to upgrade are
documented in `docs/sources/upgrading/_index.md`
- [ ] For Helm chart changes bump the Helm chart version in
`production/helm/loki/Chart.yaml` and update
`production/helm/loki/CHANGELOG.md` and
`production/helm/loki/README.md`. [Example
PR](
|
3 years ago |
|
Salva Corts
|
c6fbff26e1
|
Add config to avoid caching stats for recent data (#9537)
**What this PR does / why we need it**: When we query the stats for recent data, we query both the ingesters and the index gateways for the stats. |
3 years ago |
|
Ivana Huckova
|
eb7dae4583
|
Loki: Improve error message when step too low (#9641)
**What this PR does / why we need it**: In https://github.com/grafana/grafana/pull/69648 we are in Grafana introducing a step editor in Loki. Unfortunately, the error message when user sets too low step parameter is hard to understand, so I am proposing following change to make it more understandable and actionable. Let me know what do you think. --------- Co-authored-by: J Stickler <julie.stickler@grafana.com> |
3 years ago |
|
Salva Corts
|
af287ac3eb
|
Add summary stats and metrics for stats cache (#9536)
**What this PR does / why we need it**:
When a query finishes, we return (and log) the following stats:
```go
Cache.Chunk.Requests 0
Cache.Chunk.EntriesRequested 0
Cache.Chunk.EntriesFound 0
Cache.Chunk.EntriesStored 0
Cache.Chunk.BytesSent 0 B
Cache.Chunk.BytesReceived 0 B
Cache.Chunk.DownloadTime 0s
Cache.Index.Requests 0
Cache.Index.EntriesRequested 0
Cache.Index.EntriesFound 0
Cache.Index.EntriesStored 0
Cache.Index.BytesSent 0 B
Cache.Index.BytesReceived 0 B
Cache.Index.DownloadTime 0s
Cache.Result.Requests 13
Cache.Result.EntriesRequested 13
Cache.Result.EntriesFound 13
Cache.Result.EntriesStored 0
Cache.Result.BytesSent 0 B
Cache.Result.BytesReceived 2.5 kB
Cache.Result.DownloadTime 4.600266ms
```
In addition to that, we log the following in metrics.go:
```
level=info ts=2023-05-29T09:17:10.93029945Z caller=metrics.go:152 component=frontend org_id=145265 traceID=52d59b78fe6b9221 sampled=true latency=fast query="{cluster=\"dev-us-central-0\", namespace=~\"loki.*\", container=~\"distributor|ingester
|promtail|index-gateway|compactor\"} |= \"thislinewillnotexist\"" query_hash=1194136170 query_type=filter range_type=range length=3h0m0s start_delta=165h37m24.930289434s end_delta=162h37m24.930289612s step=43s duration=2.473055ms status=200 lim
it=30 returned_lines=0 throughput=0B total_bytes=0B lines_per_second=0 total_lines=0 total_entries=0 store_chunks_download_time=0s queue_time=0s splits=13 shards=0 cache_chunk_req=0 cache_chunk_hit=0 cache_chunk_bytes_stored=0 cache_chunk_bytes
_fetched=0 cache_chunk_download_time=0s cache_index_req=0 cache_index_hit=0 cache_index_download_time=0s cache_result_req=13 cache_result_hit=13 cache_result_download_time=4.600266ms
```
With the goal of being able to better monitor how the stats cache is
performing; this PR adds stats for the index stats cache, similarly to
how it's done for the results cache.
Here's an example of the new stats being returned and printed:
```go
...
Cache.StatsResult.Requests 180
Cache.StatsResult.EntriesRequested 129
Cache.StatsResult.EntriesFound 129
Cache.StatsResult.EntriesStored 51
Cache.StatsResult.BytesSent 0 B
Cache.StatsResult.BytesReceived 75 kB
...
```
And the new stats from metrics.go
```
... caller=metrics.go:155 ... cache_stats_results_req=129 cache_stats_results_hit=129 cache_stats_results_download_ti
me=156.864429ms ...
```
**Special notes for your reviewer**:
- Blocked by https://github.com/grafana/loki/pull/9535
- Note the new`stats.GetOrCreateContext` func. It's used inside the
`query.Exec` method so we don't overwrite the stats added in the stats
middleware.
**Checklist**
- [x] Reviewed the
[`CONTRIBUTING.md`](https://github.com/grafana/loki/blob/main/CONTRIBUTING.md)
guide (**required**)
- [ ] Documentation added
- [x] Tests updated
- [ ] `CHANGELOG.md` updated
- [ ] Changes that require user attention or interaction to upgrade are
documented in `docs/sources/upgrading/_index.md`
- [ ] For Helm chart changes bump the Helm chart version in
`production/helm/loki/Chart.yaml` and update
`production/helm/loki/CHANGELOG.md` and
`production/helm/loki/README.md`. [Example
PR](
|
3 years ago |
|
Salva Corts
|
1694ad0f9b
|
Stats cache can be configured independently (#9535)
**What this PR does / why we need it**:
Before this PR, the index stats cache would use the same config as the
query results cache. This was a limitation since:
1. We would not be able to point to a different cache for storing the
index stats if needed.
2. We would not be able to add specific settings for this cache, without
adding it to the results cache.
In this PR, we refactor the index stats cache config to be independently
configurable. Note that if it's not configured, it will try to use the
results cache settings.
**Which issue(s) this PR fixes**:
This is needed for:
- https://github.com/grafana/loki/pull/9537
- https://github.com/grafana/loki/pull/9536
**Special notes for your reviewer**:
- This PR also refactors all the tripperwares in rountrip.go to reuse
the same stats tripperware instead of each one creating their own.
- Configuring a new cache in rountrip.go is a requirement for
https://github.com/grafana/loki/pull/9536 so the stats summary can
distinguish before the stats cache and the results cache.
**Checklist**
- [x] Reviewed the
[`CONTRIBUTING.md`](https://github.com/grafana/loki/blob/main/CONTRIBUTING.md)
guide (**required**)
- [x] Documentation added
- [x] Tests updated
- [x] `CHANGELOG.md` updated
- [ ] Changes that require user attention or interaction to upgrade are
documented in `docs/sources/upgrading/_index.md`
- [ ] For Helm chart changes bump the Helm chart version in
`production/helm/loki/Chart.yaml` and update
`production/helm/loki/CHANGELOG.md` and
`production/helm/loki/README.md`. [Example
PR](
|
3 years ago |
|
Salva Corts
|
87a659a6db
|
Add span events for index stats and result cache (#9552)
**What this PR does / why we need it**:
This PR adds events to the traces to have some extra observability for
how we compute the index stats. We also add some trace events to the
results cache.


**Special notes for your reviewer**:
**Checklist**
- [ ] Reviewed the
[`CONTRIBUTING.md`](https://github.com/grafana/loki/blob/main/CONTRIBUTING.md)
guide (**required**)
- [ ] Documentation added
- [ ] Tests updated
- [ ] `CHANGELOG.md` updated
- [ ] Changes that require user attention or interaction to upgrade are
documented in `docs/sources/upgrading/_index.md`
- [ ] For Helm chart changes bump the Helm chart version in
`production/helm/loki/Chart.yaml` and update
`production/helm/loki/CHANGELOG.md` and
`production/helm/loki/README.md`. [Example
PR](
|
3 years ago |
|
Owen Diehl
|
2efd059b49
|
Slight improvements to `GetFactorOfTime` (#9473)
* correctly returns zero for non-overlapping data * adds tests |
3 years ago |
|
Paul Rogers
|
14370bb8ce
|
Revert "Augment statistics.." PR 9400. (#9430)
**What this PR does / why we need it**: This PR reverts PR 9400. The data collected within that PR was not sufficient. When queries are done, they are filtered before the merge iterator, resulting in an inability to collect an accurate count of duplicated data. **Which issue(s) this PR fixes**: **Special notes for your reviewer**: **Checklist** - [ ] Reviewed the [`CONTRIBUTING.md`](https://github.com/grafana/loki/blob/main/CONTRIBUTING.md) guide (**required**) - [ ] Documentation added - [ ] Tests updated - [ ] `CHANGELOG.md` updated - [ ] Changes that require user attention or interaction to upgrade are documented in `docs/sources/upgrading/_index.md` |
3 years ago |
|
Paul Rogers
|
1671751cbd
|
Augment statistics to note how many bytes are in duplicate lines due to replicas (#9400)
**What this PR does / why we need it**: This PR is for counting the number of bytes of log lines that were marked as duplicates. This will be utilized to collect better statistics. |
3 years ago |
|
Peter Štibraný
|
90a1d4593e
|
Update Prometheus dependency (#9205)
|
3 years ago |
|
Salva Corts
|
422560b6b1
|
Flag to disable index stats cache (#9177)
**What this PR does / why we need it**: At https://github.com/grafana/loki/pull/8972 we started caching all index stats requests. If the results cache gets overloaded, it can quickly take down the rest of the loki cell due to all the increased work. This PR adds a new flag so we can easily disable caching index stats requests. **Which issue(s) this PR fixes**: This PR is a follow up for https://github.com/grafana/loki/pull/8972 **Special notes for your reviewer**: **Checklist** - [x] Reviewed the [`CONTRIBUTING.md`](https://github.com/grafana/loki/blob/main/CONTRIBUTING.md) guide (**required**) - [x] Documentation added - [x] Tests updated - [x] `CHANGELOG.md` updated - [ ] Changes that require user attention or interaction to upgrade are documented in `docs/sources/upgrading/_index.md` |
3 years ago |
|
Salva Corts
|
fd16425062
|
Cache index stats requests (#8972)
**What this PR does / why we need it**: As described in https://github.com/grafana/loki/issues/8973, we are substantially increasing the load of index stat requests we sent to our index gateways. Many of these requests should be easily re-used by caching them. This PR adds caching for index stat requests by reusing the results cache. Here's a demo ([source][1]):  **Which issue(s) this PR fixes**: Fixes https://github.com/grafana/loki/issues/8973 **Special notes for your reviewer**: **Checklist** - [x] Reviewed the [`CONTRIBUTING.md`](https://github.com/grafana/loki/blob/main/CONTRIBUTING.md) guide (**required**) - [ ] Documentation added - [x] Tests updated - [x] `CHANGELOG.md` updated - [ ] Changes that require user attention or interaction to upgrade are documented in `docs/sources/upgrading/_index.md` [1]: https://ops.grafana-ops.net/d/afcaef21-e5ad-49e7-ab06-42a9d7d915eb/index-stats?orgId=1&var-datasource=dev-cortex&var-cluster=dev-eu-west-2&var-namespace=loki-dev-009&var-loki_datasource=Grafana%20Logging&from=1680259907288&to=1680260431814&var-operation=All --------- Co-authored-by: Owen Diehl <ow.diehl@gmail.com> |
3 years ago |
|
Salva Corts
|
8cf921a145
|
Pass engine opts down to middlewares (#9130)
**What this PR does / why we need it**:
The following middlewares in the query frontend uses a downstream
engine:
- `NewQuerySizeLimiterMiddleware` and `NewQuerierSizeLimiterMiddleware`
- `NewQueryShardMiddleware`
- `NewSplitByRangeMiddleware`
These were all creating the downstream engine as follows:
```go
logql.NewDownstreamEngine(logql.EngineOpts{LogExecutingQuery: false}, DownstreamHandler{next: next, limits: limits}, limits, logger),
```
As can be seen, the [engine options configured in Loki][1] were not
being used at all. In the case of `NewQuerySizeLimiterMiddleware`,
`NewQuerierSizeLimiterMiddleware` and `NewQueryShardMiddleware`, the
downstream engine was created to get the `MaxLookBackPeriod`. When
creating a new Downstream Engine as above, the `MaxLookBackPeriod`
[would always be the default][2] (30 seconds).
This PR fixes this by passing down the engine config to these
middlewares, so this config is used to create the new downstream
engines.
**Which issue(s) this PR fixes**:
Adresses some pending tasks from
https://github.com/grafana/loki/pull/8670#issuecomment-1507031976.
**Special notes for your reviewer**:
**Checklist**
- [x] Reviewed the
[`CONTRIBUTING.md`](https://github.com/grafana/loki/blob/main/CONTRIBUTING.md)
guide (**required**)
- [ ] Documentation added
- [x] Tests updated
- [x] `CHANGELOG.md` updated
- [ ] Changes that require user attention or interaction to upgrade are
documented in `docs/sources/upgrading/_index.md`
[1]:
|
3 years ago |
|
Trevor Whitney
|
c587b538ed
|
Fail through to next middleware when querySizeLimit cannot be applied (#9050)
**What this PR does / why we need it**: When the query size limiter can't limit the query, fail through to the next middleware instead of erroring. This can happen, for example, when a query spans schemas, which is still a valid query case, so we want to make sure to fall back to existing behavior. --------- Co-authored-by: Owen Diehl <ow.diehl@gmail.com> |
3 years ago |
|
Owen Diehl
|
acb40ed40e
|
Eager stream merge (#8968)
This PR introduces a specialized heap based datastructure to merge
incoming log results in the frontend. Recently we've experienced an
increase in OOMs on frontends due to logs queries which match lots of
data. Sharded requests in loki split based on the amount of data we
expect and some queries see thousands of sub requests. For log queries,
we'll fetch up the `limit` from each shard, return them to the frontend,
and merge. High shard counts * limit log lines, especially combined with
large log lines (in byte terms) are accumulated on the frontend. Once
they all are received, the frontend merges them. This creates
opportunity for OOMs as it can hold up a lot of memory.

This PR addresses one of these problems by eagerly accumulating
responses as they're received and only retaining a total `limit` number
of entries. There's still OOM potential due to race conditions between
sub requests returning to the query-frontend and the query-frontend
merging other sub requests, but this definitely improves the situation.
I've been able to consistently run large limited queries that touch TBs
of data (i.e. `{cluster=~".+"} |= "a"`) that previously OOMed frontends.

---------

Signed-off-by: Owen Diehl <ow.diehl@gmail.com>
|
3 years ago |
|
Owen Diehl
|
62403350a5
|
remove redundant splitby middleware (#8996)
Found this double-copied line which a mistake. This PR removes one of them which won't change behavior (besides removing duplicate spans/etc). |
3 years ago |
|
Ed Welch
|
b892cade6a
|
Loki: Fixes incorrect query result when querying with start time == end time (#8979)
**What this PR does / why we need it**: In several places within Loki we need to determine if a query is a `range query` or `instant query`, this is done by checking to see if the start and end time are equal **and** the `step=0` The downstream handler was not checking for `step=0` and thus it incorrectly mapped a range query to an instant query when a query has a start time equal to and end time. There are a few other things at play here, mainly that we should really error anytime someone tries to run an instant query for logs which would have exposed this error much more easily. But that's something I'd like to handle in a different PR as it will be considered a breaking change depending on how we do it. This PR uses an existing function we have for testing the query type and addresses the issue found in #8885 **Which issue(s) this PR fixes**: Fixes #8885 **Special notes for your reviewer**: **Checklist** - [ ] Reviewed the [`CONTRIBUTING.md`](https://github.com/grafana/loki/blob/main/CONTRIBUTING.md) guide (**required**) - [ ] Documentation added - [ ] Tests updated - [x] `CHANGELOG.md` updated - [ ] Changes that require user attention or interaction to upgrade are documented in `docs/sources/upgrading/_index.md` --------- Signed-off-by: Edward Welch <edward.welch@grafana.com> |
3 years ago |
|
Ed Welch
|
edc6b0bff7
|
Loki: Add a limit for the [range] value on range queries (#8343)
Signed-off-by: Edward Welch <edward.welch@grafana.com>

**What this PR does / why we need it**:

Loki does not currently split queries by time to a value smaller than
what's in the [range] of a range query.

Example

```
sum(rate({job="foo"}[2d]))
```

Imagine now this query being executed over a longer window of a few days
with a step of something like 30m.

Every step evaluation would query the last [2d] of data.

There are use cases where this is desired, specifically if you force the
step to match the value in the range, however what is more common is
someone accidentally uses `[$__range]` in here instead of
`[$__interval]` within Grafana and then sets the query time selector to
a large value like 7 days.

This PR adds a limit which will fail queries that set the [range] value
higher than the configured limit.

It's disabled by default.

In the future it may be possible for Loki to perform splits within the
[range] and remove the need for this limit, but until then this can be
an important safeguard in clusters with a lot of data.


**Which issue(s) this PR fixes**:
Fixes #8746

**Special notes for your reviewer**:

**Checklist**
- [ ] Reviewed the
[`CONTRIBUTING.md`](https://github.com/grafana/loki/blob/main/CONTRIBUTING.md)
guide (**required**)
- [ ] Documentation added
- [ ] Tests updated
- [ ] `CHANGELOG.md` updated
- [ ] Changes that require user attention or interaction to upgrade are
documented in `docs/sources/upgrading/_index.md`

---------

Signed-off-by: Edward Welch <edward.welch@grafana.com>
Co-authored-by: Karsten Jeschkies <karsten.jeschkies@grafana.com>
Co-authored-by: Vladyslav Diachenko <82767850+vlad-diachenko@users.noreply.github.com>
|
3 years ago |
|
Dylan Guedes
|
9159c1dac3
|
Loki: Improve spans usage (#8927)
**What this PR does / why we need it**: - At different places, inherit the span/spanlogger from the given context instead of instantiating a new one from scratch, which fix spans being orphaned on a read/write operation. - At different places, turn spans into events. Events are lighter than spans and by having fewer spans in the trace, trace visualization will be cleaner without losing any details. - Adds new spans/events to places that might be a bottleneck for our writes/reads. |
3 years ago |
|
Periklis Tsirakidis
|
1bcf683513
|
Expose optional label matcher for label values handler (#8824)
|
3 years ago |
|
Salva Corts
|
45775c82f7
|
Implement `RequiredNumberLabels` query limit (#8918)
**What this PR does / why we need it**: As pointed out in https://github.com/grafana/loki/pull/8851, some queries can impose a great workload on a cluster by selecting too many streams. Similarly to the `RequiredLabels` limit introduced at https://github.com/grafana/loki/pull/8851, here we add a new limit `RequiredNumberLabels` to require queries to specify at least N label. For example, if the limit is set to 2, then the query should contain at least 2 label matchers. This limit can be configured per tenant and at query time.  **Which issue(s) this PR fixes**: Fixes https://github.com/grafana/loki-private/issues/699 **Special notes for your reviewer**: **Checklist** - [x] Reviewed the [`CONTRIBUTING.md`](https://github.com/grafana/loki/blob/main/CONTRIBUTING.md) guide (**required**) - [x] Documentation added - [x] Tests updated - [x] `CHANGELOG.md` updated - [ ] Changes that require user attention or interaction to upgrade are documented in `docs/sources/upgrading/_index.md` --------- Co-authored-by: Dylan Guedes <djmgguedes@gmail.com> |
3 years ago |
|
Salva Corts
|
ee69f2bd37
|
Split index request in 24h intervals (#8909)
**What this PR does / why we need it**: At https://github.com/grafana/loki/pull/8670, we applied a time split of 24h intervals to all index stats requests to enforce the `max_query_bytes_read` and `max_querier_bytes_read` limits. When the limit is surpassed, the following message get's displayed:  As can be seen, the reported bytes read by the query are not the same as those reported by Grafana in the lower right corner of the query editor. This is because: 1. The index stats request for enforcing the limit is split in subqueries of 24h. The other index stats rquest is not time split. 2. When enforcing the limit, we are not displaying the bytes in powers of 2, but powers of 10 ([see here][2]). I.e. 1KB is 1000B vs 1KiB is 1024B. This PR adds the same logic to all index stats requests so we also time split by 24 intervals all requests that hit the Index Stats API endpoint. We also use powers of 2 instead of 10 on the message when enforcing `max_query_bytes_read` and `max_querier_bytes_read`. 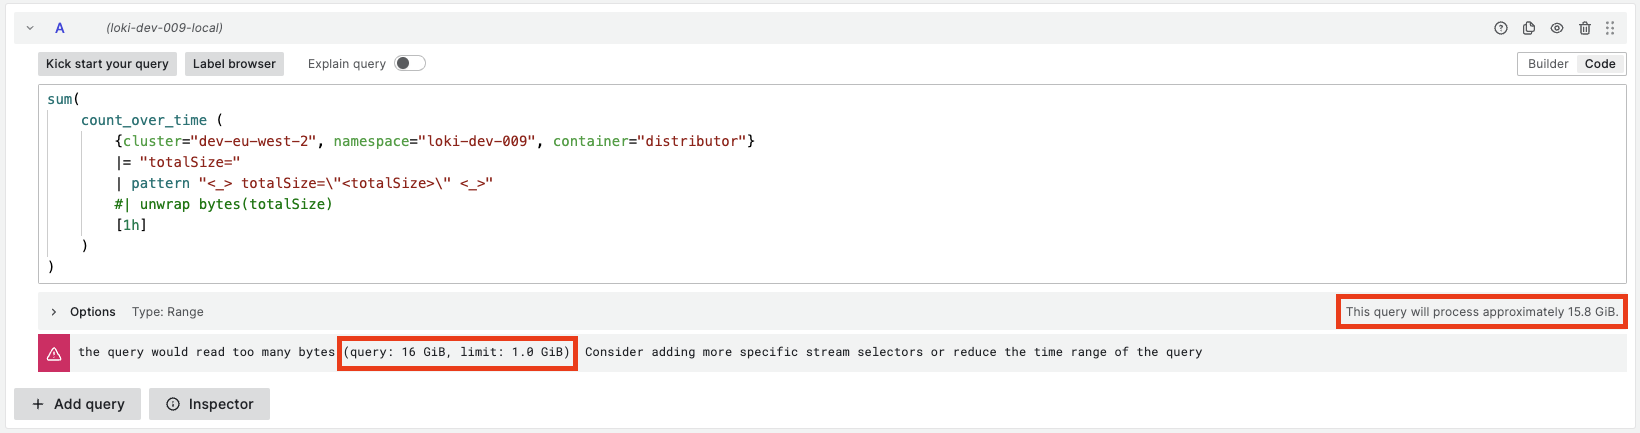 Note that the library we use under the hoot to print the bytes rounds up and down to the nearest integer ([see][3]); that's why we see 16GiB compared to the 15.5GB in the Grafana query editor. **Which issue(s) this PR fixes**: Fixes https://github.com/grafana/loki/issues/8910 **Special notes for your reviewer**: - I refactored the`newQuerySizeLimiter` function and the rest of the _Tripperwares_ in `rountrip.go` to reuse the new IndexStatsTripperware. So we configure the split-by-time middleware only once. **Checklist** - [x] Reviewed the [`CONTRIBUTING.md`](https://github.com/grafana/loki/blob/main/CONTRIBUTING.md) guide (**required**) - [x] Documentation added - [x] Tests updated - [x] `CHANGELOG.md` updated - [ ] Changes that require user attention or interaction to upgrade are documented in `docs/sources/upgrading/_index.md` [1]: https://grafana.com/docs/loki/latest/api/#index-stats [2]: https://github.com/grafana/loki/blob/main/pkg/querier/queryrange/limits.go#L367-L368 [3]: https://github.com/dustin/go-humanize/blob/master/bytes.go#L75-L78 |
3 years ago |


